Hello everyone,
Various charts and graphs this week. Great stuff!
- Turn it up to 11!
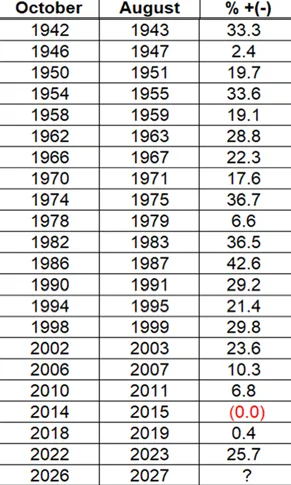
We have entered a rather intriguing, and historically profitable, cycle for the stock market. We can thank the hard-working folks at Sentiment Trader for discovering this hidden gem, which I don’t think has been uncovered until now. I certainly haven’t seen it before.
Researchers decided to plug the following into their computers: Start in October of a mid-term election year and look out the following 11 months. I’m sure they were stunned when the following numbers appeared on their screens.
Source: Sentiment Trader, 10-01-26
That’s one of the most one-sided pieces of research I’ve ever seen when looking at past performance outcomes. And yes, we certainly know about past performance. It doesn’t guarantee us anything. Got it. But I mean, c’mon. You’re looking at a large sample size dating back to World War II. It includes 21 events without a single down year. Five of the 21 have produced double digit returns, and the average return comes in at 21.26%. That’s slightly more than the double the long-term average of the S&P 500.
Why just 11 months? And why is it October through August instead of another 11-month period? Sentiment Trader doesn’t offer an opinion or analysis, and neither shall I. You certainly have the seasonal elements I’ve written about before, namely returns following a mid-term election. But let’s not quibble with the reasons. Let’s just marvel at the outcomes. And hope that history repeats itself for a 22nd time.
- Complaining but still spending.
“Do as I do, not as I say.”
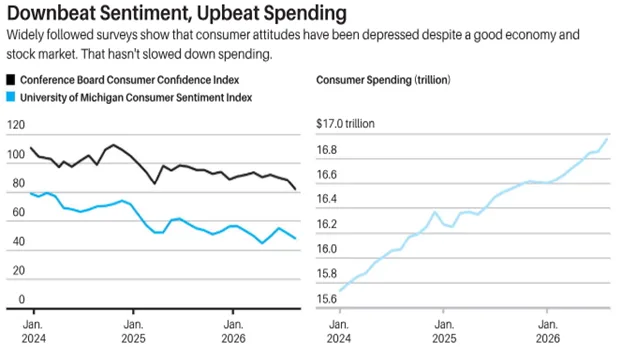
We’re twisting the words of a common phrase to make a point about American consumers these days. What they say, do, and feel are at odds with one another.
Source: Barron’s, 10-3-26
Folks are complaining about higher gas prices, the Iranian war, the upcoming mid-terms, and the Cardinals posting a second consecutive losing season, the first that’s happened since 1958-59. (Okay, maybe it’s just me on the last one.) And yet…and yet…consumer spending continues to skyrocket to record highs. Restaurants are packed, planes are full, and cruise ships are nearly sold out through 2027. And those are the big-ticket items. We’re not even talking about everyday items.
Yes, we know about the K-economy and how spending patterns are uneven among income classes. But Wall Street only cares about that topline number of consumer spending. Until the folks with money start hunkering down in their homes, the upward trendline will continue giving a floor to the stock market.
- Most stocks missing in action.
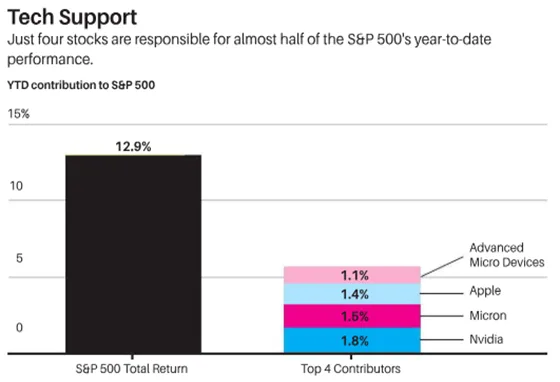
The S&P 500 ended September with a barely perceptible decline of -0.5%. So it may come as a surprise when I tell you that nearly 80% of the stocks that make up the S&P actually finished down for the month, with the average stock falling about 5%. I’ve written about the top-heavy market in past commentaries, and September was the perfect example of it. Just a handful of stocks gave the S&P its performance last month, which has continued the year-to-date trend as this slide shows.
Source: Wall Street Journal, 10-5-26
As of Monday, 204 companies were down more than 20% from their respective highs. Just think about that for a second. The S&P 500 hit an all-time high this week while more than 40% of its members were stuck in their own bear markets. The bears among us have pointed out that such lopsided leadership has presaged major corrections in the past. There’s some truth to that. Some. But the evidence isn’t overwhelming. Sometimes the laggards eventually catch a bid and start making up for lost time, keeping the long running bull motoring ahead. Even if that doesn’t happen there’s no indication that the current bull is about to crack. There are past examples of narrow leadership lasting for many years.
My opinion remains the same. The stock market could run through a normal correction at any time for any number of reasons. But a full-out bear market (S&P 500 down more than 20%) is currently not on my radar. Our current models reflect that position.
- The tech train rolls right along.
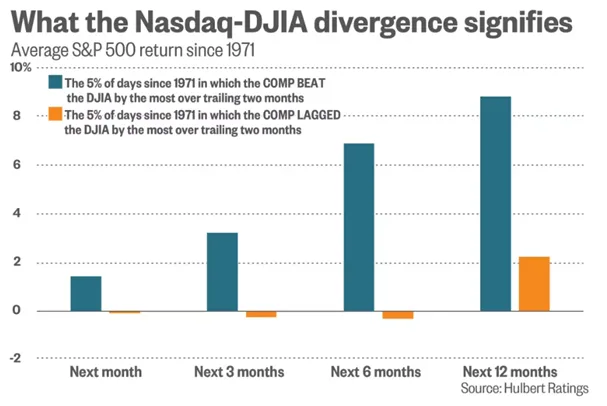
Let’s continue with this theme for a second. Over the last two months the Dow has fallen 5.7% while the tech heavy Nasdaq has risen 4.2%. That difference of nearly 10% has occurred fewer than 5% of all 2-month timeframes since the Nasdaq was established in 1971. (Thanks to Hulbert Ratings for that little nugget.) So what happens to future returns when we’ve had that kind of gap in the past?
Glad you asked. The blue bar is your answer, the S&P rising close to 9% on average over the next 12 months. That may not impress some of you. But this is all about pushing back on the narrative that the current shape of the market portends trouble.
Source: MarketWatch, 10-6-26
Look at what happens when the reverse is true, when the Nasdaq significantly underperforms the Dow over a two-month period. Not good! Once again, I wouldn’t pay too much attention to the worry warts out there who are trying to scare us about market leadership right now, especially when it comes to tech stocks. History has not been unkind to investors when these developments have occurred in the past.
- It works every time it’s tried.
As we conclude this week’s commentary, let’s remind ourselves of an important truth. Most of the day-to-day machinations of the market will quickly be forgotten. A few years from now you won’t remember much about four tech stocks giving the S&P half its performance in 2026. You may have forgotten that consumers were spending records amount of cash even while sentiment indicators plunged to new lows. You will have moved on to the latest news and developments of the day, and hopefully still getting my take on them! 😊
While you inform yourselves of the latest market news, both now and in the future, always remember this next slide, the most important one you’ll see today.
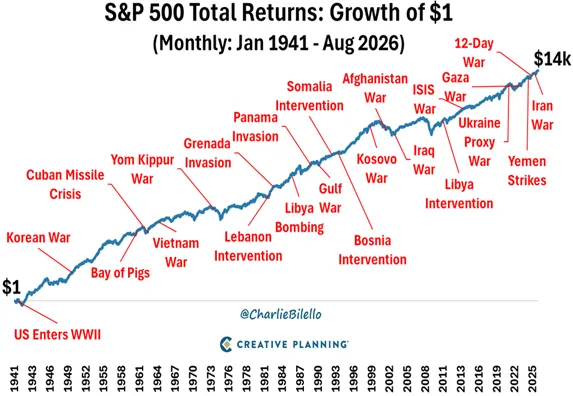
It’s notable how corrections and bear markets suddenly appear less menacing when we look at market performance from 30-thousand feet. Up and to the right, up and to the right, up and to the right.
A diversified portfolio with reasonable return expectations, along with a focus on the long term instead of the here and now, will survive any and all downdrafts in financial markets. It’s a truism that works every time it’s tried.
I’ve been in front of a camera or behind a microphone for nearly 45 years, dating back to my Mizzou J-school days. And yet I still cringe every time I review my work. I should’ve said this, I talked in circles on that, my energy was off, blah blah blah. So it’s a real treat when I finish reviewing a piece and let out a sigh of relief. “I must say, that was a pretty good effort there, Dave. Nice job.” Such is the case with this week’s Simons Says episode, although you’ll see I make one statistical error that I have to correct with a line on the screen. Hey, it happens. But my nod of approval couldn’t come at a better time. This week’s topic is a very important one for me. You’ll notice I’ve addressed it in one form or another more than a couple of times this year. It’s a little less than 10 minutes so please check it out. I promise it’ll be worth your time!
Sequence of Returns Risk: Why Retirement Portfolios Can Run Out of Money

That’s it from here, friends. The usual format, complete with Odds and Ends, will return next week. Until then, make it a fantastic weekend!
Dave